© 2020-23 BizApprise. All rights reserved.
60 Amazing Instagram Statistics for Individuals & Marketers
As of January 2023, Instagram is ranked fourth (after Facebook, YouTube, and WhatsApp respectively) as the most popular social media network worldwide, ranked by monthly active users.
Instagram has 2 billion monthly active users. Out of those users, 80% live outside of the United States. Based on audience size, India serves as the largest country.
If you want more exposure for your business on Instagram, it’s worth considering these Instagram statistics. For example, posts with hashtags tend to get more engagement than those without. And using popular, relevant hashtags can help you reach a wider audience. So if you’re not already using Instagram for your business, now might be the time to start!
60 Instagram Statistics that you should know (2023)
We’ve created a complete list of Instagram statistics that are useful for individuals, creators, influencers, and brands. Check them out!
1. Instagram Statistics – Demographics
The platform is used by people of all ages from all over the world, but some demographics are more represented than others.
1.1 Instagram Age Demographics
Age Demographics are classified into 7 categories according to the latest Digital 2022 Global report. Data shows that most of the audience is Gen Z and Millennial users.
- 13-17 years – 8.5%
- 18-24 years – 30.1%
- 25-34 years – 31.5%
- 35-44 years – 16.1%
- 45-54 years – 8%
- 55-64 years – 3.6%
- 65+ years – 2.1%
1.2 Instagram Gender Demographics
When compared to other social media platforms, gender demographics are evenly divided on Instagram. For the age group of 35+ women stand out from men with a high user base.
- Male – 50.7%
- Female – 49.3%
1.3 Instagram Location Demographics
Based on location, the top 5 countries with the most audience size are India (230.25 million), the United States (159.75 million), Brazil (119.45 million), Indonesia (99.15 million), and Russia (63 million).
India is the fastest-growing market with a growth rate of 16% QOQ.
Brunei has the largest population reach with 92% of the population using this app. Followed by Guam and Cayman respectively.
1.4 Instagram Regional Demographics
Directly related to Internet connectivity, regional demographics suggest that urban and suburban areas have a higher user base when compared to rural areas. Here is the breakdown for the United States.
- Urban – 45%
- Sub-Urban – 41%
- Rural – 25%
1.5 Instagram Education Demographics
Again as per statists 2019 report, users having a college degree have the highest user base on Instagram topped the list, followed by users pursuing a college degree, and high school users with 43%, 37%, and 33% respectively.

1.6 Instagram Income Demographics
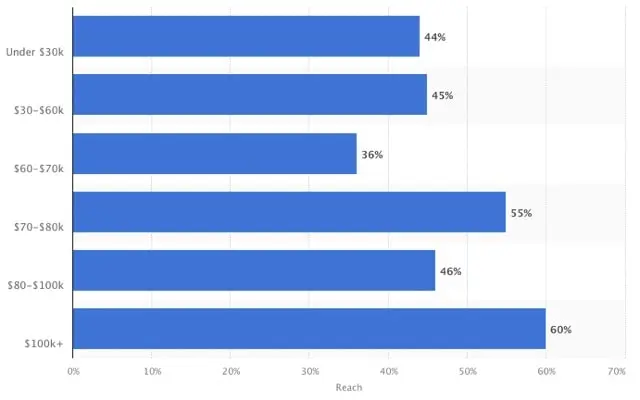
Income is not a major statistic when it comes to Instagram. But, it is good to understand. I’m taking the United States as an example to explain Instagram income demographics.
According to a report published by Statista, the group with an annual household income of $100K+ has the highest user base of 60%.

1.7 Instagram Interests Demographics
As a result of a poll created by Meta among 21,000 users, these are the outcomes.
Top Interest Types
- Travel – 45%
- Music – 44%
- Food – 43%
- Fashion – 42%
- Film – 41%
- Health and Fitness – 35%
- Technology – 32%
- Skincare – 30%
- Sports – 30%
- News – 28%
Top Content Types
- Fun/Entertaining – 55%
- Authentic – 53%
- Creative – 53%
- Informative – 51%
- Personal Interest – 46%
- Inspiring – 45%
- Beautifully Produced – 36%
2. Instagram Statistics – Usage
Do you know 70% of Instagram users are using this platform at least once daily? Stories are the most viewed feature with more than 70% of users watching them every day.
Here are the Instagram usage statistics that one should know.
1. Instagram has Monthly Average Active users of more than 1.47 billion.
2. Daily Active users crossed 500 million user base.
3. It is ranked as 4th largest social media platform based on MAUs.
4. Instagram is the 9th most-searched term on Google.
5. It is 2nd most-downloaded app in the World.
6. Gen X is the fastest-growing audience on Instagram.
7. 23.92% (out of 4.18 billion) of active mobile users are using Instagram daily.
8. 13.15% (out of 3.80 billion) of active social media users are using it daily.
9. 6.43% (out of 7.77 billion) of the world’s population uses it daily.
10. 9.5% of Instagram accounts can be bot accounts.
11. 21% of users log in weekly, and 16% log in often.
12. India has the highest number of users (180M+) on Instagram.
13. The average time spent is of 29-minutes a day.
14. The total number of employees count is just 450 serving billions of users.
15. More than 100M photos are shared daily.
16. Stories are shared by 40% of daily users of Instagrammers.
3. Instagram Statistics – Engagement
From a move from a photo-sharing app to a video-sharing app, Instagram reels created never seen engagement rate. Thanks to the support shared by hashtags and geotags to reach the potential audiences.
Here are the most-important engagement stats that you must know.
17. Post with hashtags receives 12.6% more engagement when compared to posts with no hashtags.
18. Posts with geotags have 79% more visibility.
19. The average Instagram post contains as many as 10.7 hashtags.
20. The median engagement rate on Instagram is 0.67%, video posts have an average rate of 0.61%, and carousel posts with the highest engagement rate of 1.08%.
21. Captions of around 100 words or more have a better engagement rate.
22. Per follower engagement rate is 58% more on Instagram than on Facebook.
23. 100M+ content published daily.
24. Feeds with face photos perform 40% better than any other format.
25. Video content gets 21.2% more engagement.
26. Wednesday and Thursday have the most engagement rate.
27. On average 4.2B posts are shared on Instagram daily.
28. The average number of likes per post is 1,261.
4. Instagram Statistics – Business
29. As of 2019, 9.5% of fake accounts cost brands $1.3 billion every year.
30. 90% of the users are following at least a business account.
31. The average growth rate of a business account is 1.69% each month.
32. Half of the brands get discovered on Instagram and interact with products or services offered by brands.
33. 57% of the audience loves to see or participate in polls and quizzes from brands.
34. 44% of business account followers use Instagram to shop weekly.
35. 58% of marketers are planning to leverage reels in 2022.
36. Business Accounts with followers of less than 10,000 have an average engagement rate of 1.11%
37. Accounts with 10K to 100K followers have an engagement rate of 0.93%.
38. 58% of users know about a brand after seeing it in the story.
39. Business accounts have an 86% completion rate on stories.
40. The average stories count per month by most active brands is 17 stories per month.
5. Instagram Statistics – Ads
41. 80% of the stories with voiceover or music drive better low-funnel results than ads with no sound.
42. 25% of Instagram’s Ad revenue is generated through story ads.
43. Instagram Advertising reach outplace Facebook with Instagram Ads growth rate of 20.5%.
44. The average CPC is between $0.70 to $1.00.
45. 38% of marketing agencies used to take benefit of Instagram Ads.
46. 91% of the top luxury brands work with an influencer as part of their advertisement strategy.
47. After LinkedIn and Facebook, Instagram is 3rd most platform to which advertisers want to devote time and money.
6. Other Instagram Statistics
48. Video content generates 2X more comments than image posts.
49. US marketing companies spend 31% of the total ad budget on Instagram Stories.
50. 500M+ stories get posted on Instagram every day.
51. Over 200M+ business accounts marketing their products or services on Instagram.
52. A photo of an egg is the most-liked photo on Instagram with 55.8M+ likes.
53. After Instagram, Cristiano Ronaldo is the most-followed account with 496M+ followers.
54. #Love is the most-popular hashtag on Instagram.
55. Collection ads have a 6% more conversion rate.
56. 98% of fashion brands are on Instagram.
57. Users from the age group of 25-34 years are the highest targeted audience by advertisers.
58. Using product tags on a post leads to product page visits.
59. 75% of the brand posts are single-image posts.
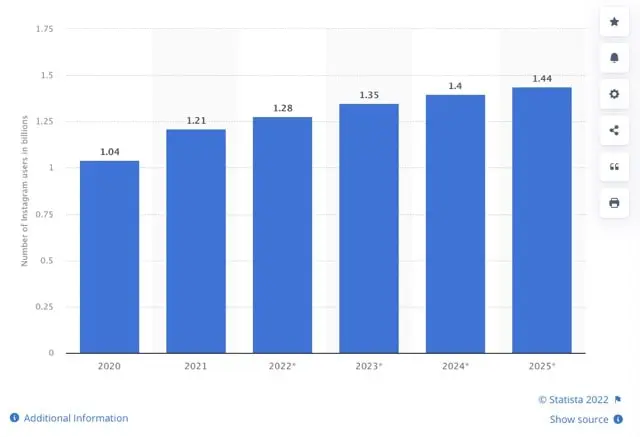
60. By 2025, predicated active monthly users will be 1.44B+.

FAQs on Instagram Stats
How effective is Instagram for marketing?
There is no simple answer to this question as the effectiveness of Instagram for marketing depends on several factors, including the type of business, the products or services being promoted, the target audience, and the level of competition.
However, some businesses have found Instagram to be an effective marketing platform, especially for visual products or services.
How has Instagram changed the marketing industry?
Instagram has changed the marketing industry in several ways. Perhaps the most notable way is by increasing the importance of visual content. With over 1 billion monthly active users, Instagram is a powerful platform for businesses to reach their target audiences. However, simply having a presence on the platform is not enough. Businesses need to produce high-quality, engaging content to capture the attention of users.
In addition to the visual element, Instagram has also made it easier for businesses to connect with their customers and create a community around their brand. Through the use of hashtags, geotagging, and other features, businesses can connect with like-minded people and promote their products or services.
Why brands should use reels?
Reels allow them to connect with their audience in a more personal and authentic way. Reels allow brands to show off their personality and values, which can help to build trust and loyalty among their target consumers.
Additionally, using reels can help brands to boost their visibility and reach on social media, as well as increase the chances of their content being shared.
Final Thoughts on Stats on Instagram
These statistics give us a good overview of who is using Instagram and how they are using it. However, it’s important to keep in mind that these numbers are always changing as the platform continues to grow and evolve.
These statistics show that Instagram is a hugely popular platform with a global audience. It is used extensively by users all over the world, with a large proportion of users spending a significant amount of time on the app every day.


